 2020 UtahJS Survey Results
In October of 2020, a survey of UtahJS members was conducted through the group's slack channel around the topics of compensation, education, Covid-19, and other issues. Presented here are an analysis of the results, as well as some commentary, and a link to the raw result data.
Jump To:
- Demographics
- Compensation
- Education
- Location
- Benefits
- Raises
- Covid-19 Effects
- Previous years
- Link to data & licenses
Tip: For charts with lots of data, hover over (or click) a chart series in the label to see those points highlighted.
Demographics
I would consider myself a...
This year, members were asked to bucket themselves in to job-titles, such as "Junior Developer" or "Engineering Manager"
Also, included in the Other category were (with 1 response each):
- Architect
- Entrepreneur
- Senior Junior
How much experience do people have in different roles?
Some observations:
- Despite the appearance of the chart, there aren't any statstical outliers in the senior category. There's a smooth distribution between 10 and 25 years.
- Title inflation: the highest-experience "junior engineer" has more experience than the lowest-experience "senior engineer." It's my opinion that the first two quartiles of "senior engineer" may not be describing themselves accurately.
What are the experience levels for all of the survey respondents?
Gender of respondents...
This year the survey asked about gender, with the option of entering their own response in free-form text.
Other responses included:
- Prefer not to say
- Transgender
- Non-binary
Compensation
This year, the survey included compensation questions about base pay (cash compensation), liquid equity (stock), non-reoccurring bonuses, pay changes from changing employers, as well as important benefits.
Cash Compensation aka Salary
Curriously, no "0" responses were entered this year, which usually happens with students, new graduates, or unemployed people responding to the survey.
How does compensation change with experience?
Comparison to previous years
Tip: Hover over each year to highlight them individually
Total Comp (sum of salary, bonuses, and equity)
68 of 122 respondents (55%) received either a cash bonus, liquid equity, or both
Comparison: in 2019, 37% received a bonus or equity.
For the above chart, values may be higher because equity is typically distributed over a number of years. For example, respondents may have reported to recieve $100,000 equity this year, but it is vested over a 4 year period.
Of those that did receive equity or a cash bonus, what was it?
How does gender relate to compensation?
Although there are not many "female" or "other" respondents, it is heartening to see that their salary distribution is near the top of their experience cohort.
How does job title relate to compensation?
Education
What is the distribution of education types?
Survey respondents could choose multiple options from:
- Self Taught
- Bootcamp
- Bachelor's Degree
- Graduate Degree
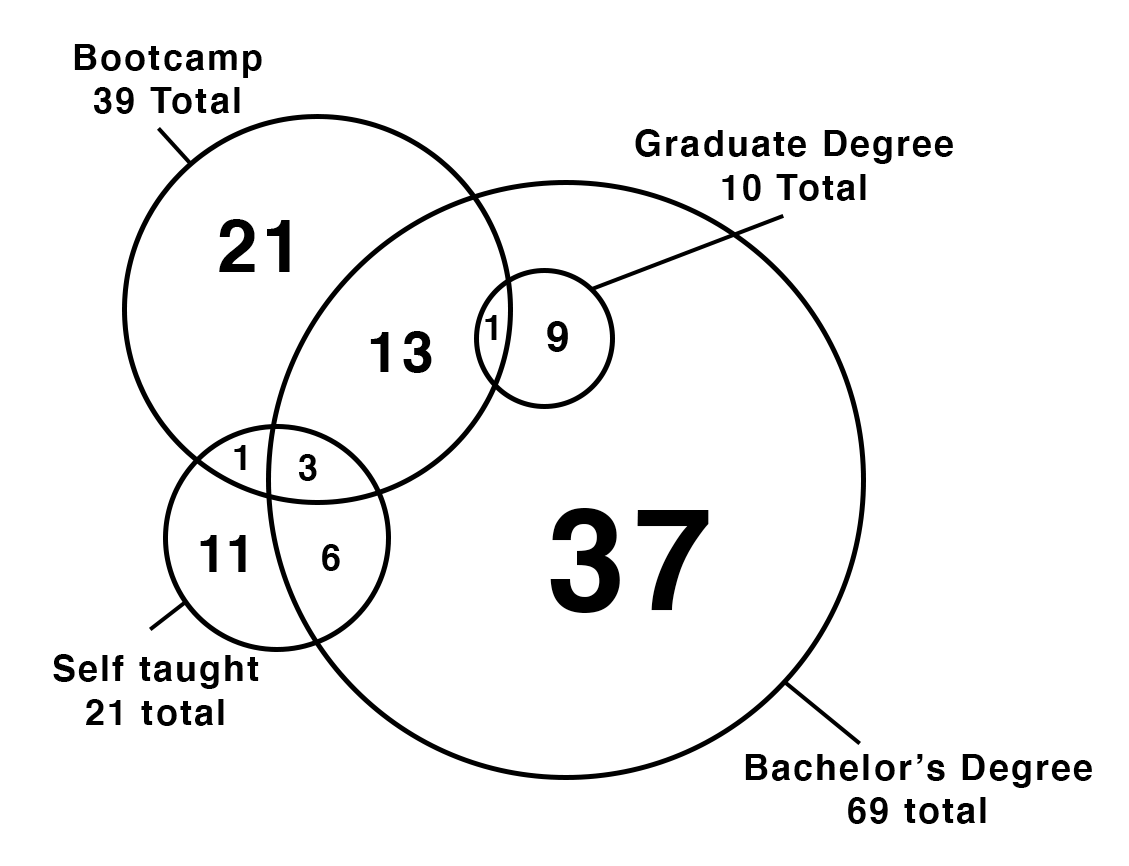
Note: couldn't find a JavaScript powered chart to describe this sort of multiple-select question. So you get my poor photoshop chart for this one!
Do different education types have different compensation distributions?
In the past, I've usually had a box plot showing the difference in compensation between, say, Bootcamp grads and Bachelor's Degree holders. After seeing several years of data, I now believe that this variation is mostly explained by experience. As time goes on, and the selection bias continues to work against bootcamp grads, I believe those that continue in their career will have comp on-par with their peers.
What type of degrees do respondents have?
While Computer Science Bachelors and Masters degrees remain the largest type of degree held, as a whole, they are a minority to non-computer-science degree holders.
"Other" degrees
- Accounting
- Advertising
- Aerospace Engineering
- Bioinformatics
- Business (5)
- Civil Engineering
- Communications (3)
- Economics (3)
- Electrical Engineering
- English (2)
- Geographic Information Systems
- Geology
- History (2)
- Industrial Design
- Korean
- Linguistics
- Mathematics (2)
- Mechanical engineering
- Music
- Psychology (3)
- Public Health
- Social Sciences
- Sociology
- Spanish
- Statistics
- University Studies
Location
Where do respondents live?
6 Respondents live remotely
Where do respondents work?
18 Respondents work remotely
Utah vs. Remote Salary
Some observations:
- Average base salary for local and remote have a very similar distribution. I imagine this will change in the coming years with the growth of remote Silicon Valley (FAANG and others) employment.
- Remote jobs have a much lager spread on equity, which probably makes them very attractive.
Benefits
What are common benefits?
Respondents were asked about other benefits they thought were particularly good. Most common were:
- 100% paid health insurance
- Unlimited PTO
- Flexible schedule
- Paid parental leave
- Education stipends & Reimbursements
- 401k Matching
Raises
How many people received a raise this year?
How does receiving a raise at your current employer compare with moving to a new employer?
Covid-19
This year I asked some questions specifically about Covid-19 and the changes in work that have happened as a result.
My job was affected by Covid-19...
Of those laid off, 6 found work (all within 1 month) and 4 are still out of work.
I'm working from...
Previous Years Results
This survey was conducted in 2017, 2018, and 2019 with similar questions:
- 2019: https://mdjasper.github.io/utah-js-survey-2019/
- 2018: https://mdjasper.github.io/utah-js-pay-data-2018/
- 2017: https://mdjasper.github.io/utah-js-pay-data/
Comparison of response rates
Some meta analysis of the survey: There was some discussion of the lower response rate this year, and it's my belief that people are suffering from Covid-19 fatigue, and are participating less in non-essential communities (like this one).